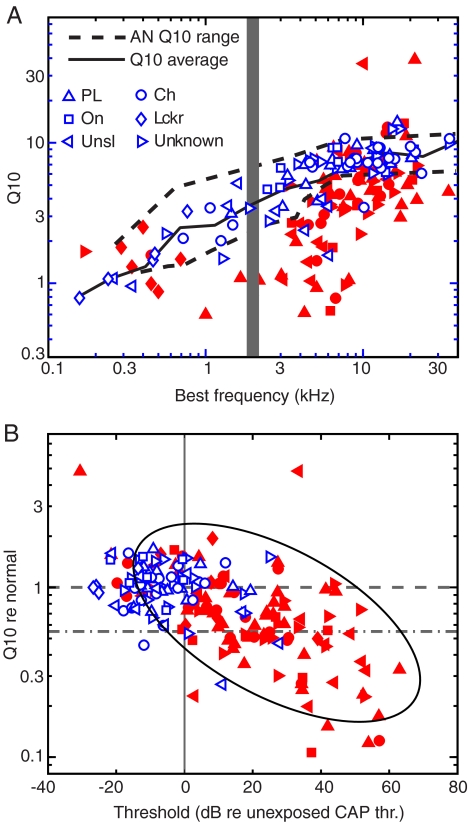
FIG. 3.
Q10 values of VCN neurons are similar to those of AN fibers in both normal and noise-exposed ears. A A summary of tuning-curve Q10s of neurons in the normal (unfilled symbols) and noise-exposed (filled symbols) populations. The gray bar indicates the frequency of the exposure noise. The upper and lower limits (5% and 95% quantiles) of Q10s of normal AN fibers from Miller et al. (1997) and Ji (2000) are overlaid for comparison (dashed lines). The solid line shows the moving average of Q10 versus BF for the control group. B Relative Q10 (normalized by the average Q10 at the same BF in the normal-hearing population) versus threshold relative to the average normal CAP audiogram (Fig. 1). The horizontal dashed line indicates the average normal Q10 values. The horizontal dash-dotted line (at 0.55) is the boundary between sharp and broad tuning used by Heinz and Young (2004), chosen to be the fifth percentile of Q10s in normal AN fibers. The ellipse shows the region occupied by AN fibers with moderate to severe loss from Figure 5 of Heinz and Young 2004 for comparison. The ellipse was shifted along the abscissa by 28 dB to account for the difference between the mean CAP threshold at 2 kHz (23.5 dB SPL) and the threshold reference used by Heinz and Young at 2 kHz (−4.5 dB SPL).

