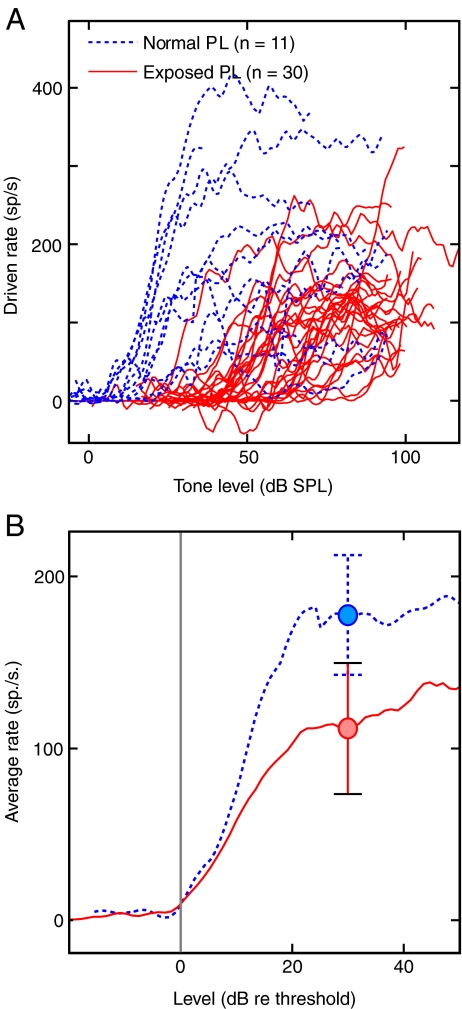
FIG. 4.
Primary-like neurons show a decrease in rate responses following AT. RLFs from Pri and PriN neurons are shown. Data in normal and exposed animals are identified by line style, defined in the caption. A BF-tone RLFs as driven rate (rate–SR). B Average firing rate versus level re threshold. The individual RLFs in A were aligned at their thresholds (vertical line) and averaged. The circles and error bars show mean ± 1 SE of rates at 30 dB re threshold.

