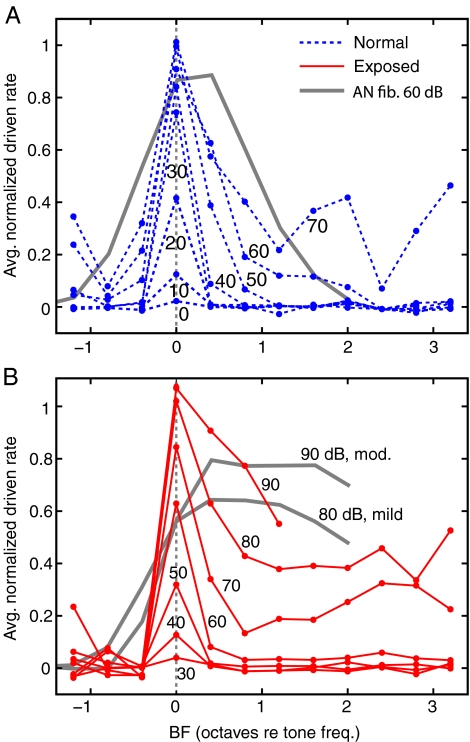
FIG. 6.
Spread of excitation is larger following AT. A Equal-level rate contours for the tonal pseudopopulation in normal animals. The rates are average normalized driven firing rates of all VCN response types, computed in 0.4 octave frequency bins, as described in the text. The numbers show sound levels in dBP. The heavy gray line shows the 60 dB SPL contour for AN fibers from Heinz et al. (2005), Figure 4, normalized in the same way. This level was chosen for comparison because it shows a clear shift in the BF at which the peak rate occurs. B Same for the exposed preparations. The heavy gray lines show 80 and 90 dB contours for AN fibers in preparations with “mild” and “moderate” hearing loss, as defined in Heinz et al. (2005). Locker neurons are not included in this figure because their BFs are far from those of other neuron types.

