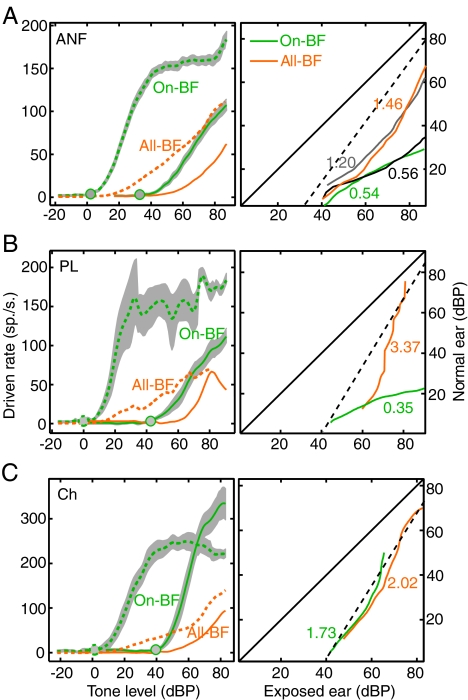
FIG. 7.
Rate-balance functions from Ch, but not PL neurons resemble perceptual loudness-balance functions. In each section, the left plot shows the average rate for normal (dashed lines) and exposed (solid lines) pseudopopulations consisting of (1) neurons with BFs within ±0.2 octaves of the tone frequency (On-BF), shown with shaded bootstrap confidence limits (±1 SD), and (2) neurons of all BFs, shown as the average rate lines only. The circles on the on-BF functions show the thresholds (3 spikes/s). The right plots show the sound levels that give the same rates in the normal and exposed populations. Matches are shown for the on-BF and all-BF populations, identified by line shading, as in the legend in A. The numbers are the slopes of best-fitting lines for the rate matches over the range of sound levels shown. The dashed lines show predictions for typical recruitment functions in human observers (see text). A AN data from Heinz et al. (2005), reanalyzed with the pseudopopulation method. Rate-matching lines and slopes are shown for both pseudopopulation analysis (slopes, 0.54 and 1.46) and from the previous real-population analysis done by Heinz and colleagues (slopes, 0.56 and 1.20). B, C Average RLFs and the corresponding rate-matching curves for PL and chopper neurons.

