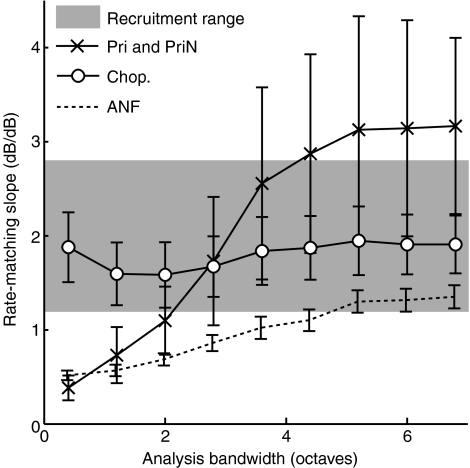
FIG. 8.
The slopes of rate-matching functions change with the averaging bandwidth for AN fibers and PL neurons, but not Ch neurons. Slopes of rate-matching functions are shown for tonal pseudopopulations as a function of the range of BFs (relative to the tone frequency) averaged together. Results are given as mean ± 1 SD of 500 bootstrap repetitions of the calculation for the same three populations as in Figure 7, identified in the legends. The shaded band shows the range of slopes of loudness-matching curves in human subjects (publications cited in the text) with hearing losses comparable to those of the exposed cats. The AN fiber data are from a reanalysis using pseudopopulations of the data of Heinz et al. (2005).

