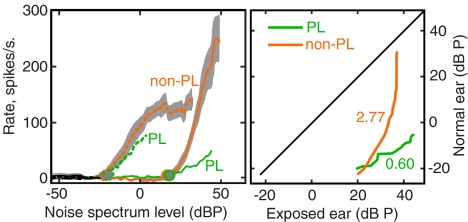
FIG. 9.
Rate-matching slopes for responses to BBN; these differ between PL and non-PL neurons as for the tone responses. The figure is drawn as in Figure 7, except that the recruitment prediction line is not shown because of uncertainty as to how recruitment should behave for BBN. Neurons are grouped into PL and non-PL pseudopopulations, and the plots show average RLFs (left) and rate-matching curves (right).

