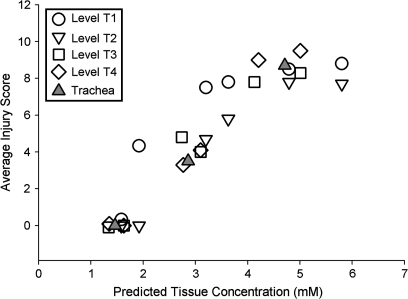
FIG. 4.
The average pathology scores for rats exposed to 100-, 200-, or 300-ppm diacetyl for 6 h from Hubbs et al. (2008) are plotted versus the CFD-PBPK model–predicted tissue concentrations at these exposure levels. Included are data from all sections of the nose (T1–T4) and all exposure concentrations.

