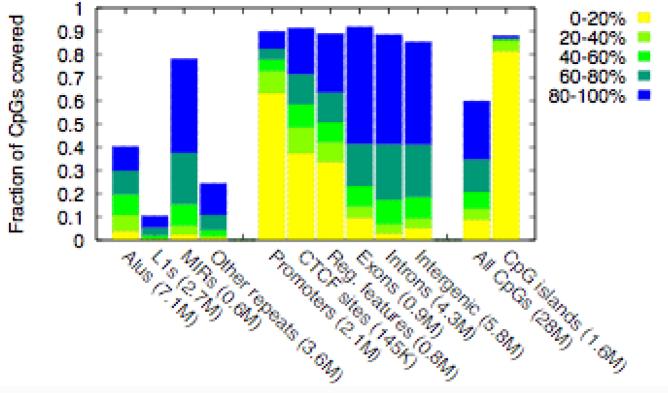
Figure 5.
Genomic coverage and web display of the MeDIP-seq data (a) Genomic coverage of MeDIP-seq (measured as fraction of CpGs). Genomic features are from the Ensembl genome database (release 45). The first ten bars are mutually exclusive, i.e. repeats are not included when considering subsequent features. Numbers in parentheses indicate the total number of CpGs within the human genome in that category. Promoters are defined as 2kb regions centered on annotated transcriptional start sites, and Reg. features represent non-promoter Regulatory Features in Ensembl. The colors represent the range of DNA methylation levels (b) MeDIP-seq data integrated into Ensembl along with MeDIP-chip data of the same sperm DNA sample, and sperm bisulfite-PCR data from the Human Epigenome Project16. The yellow – green – blue color gradient represents 0 – 100% methylation.


