
Figure 4.
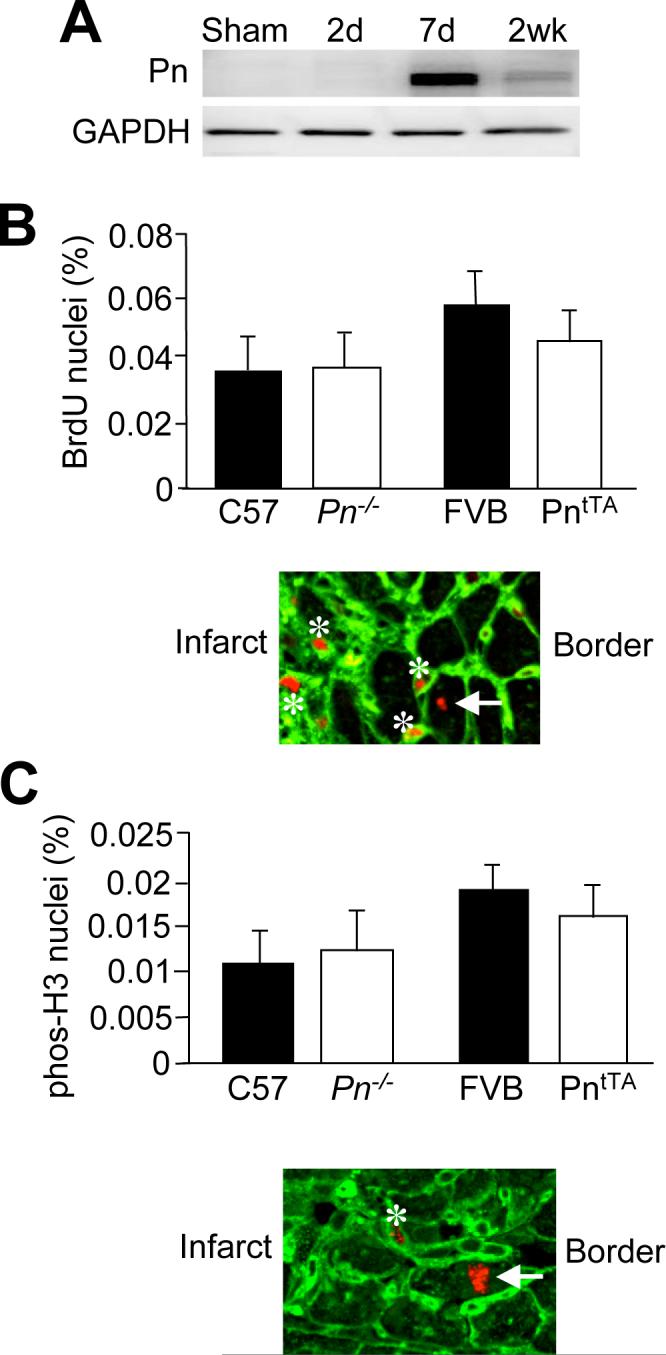
Assessment of cardiomyocyte proliferation 7 days after MI in Pn−/− and PntTA transgenic mice. A, Western blot analysis of periostin in the heart following MI. GAPDH is a loading control. B, Percent of BrdU positive cardiomyocyte nuclei when compared to total cardiomyocyte nuclei in the peri-infarct area of Pn−/−, PntTA mice and their appropriate controls. Below the graph a representative immunohistological image is shown with labeled non-myocytes (asterisk) and a labeled myocyte (arrow). C, Percent of phosphorylated histone H3 positive cardiomyocytes compared to total cardiomyocytes in the peri-infarct area of Pn−/−, PntTA mice and their appropriate controls. Below the graph a representative immunohistological image is shown with a labeled non-myocyte (asterisk) and a labeled myocyte (arrow). Experiments were performed on a minimum of 4 hearts per cohort. Greater then 100,000 cells were counted per experimental group. None of the groups were significantly different.