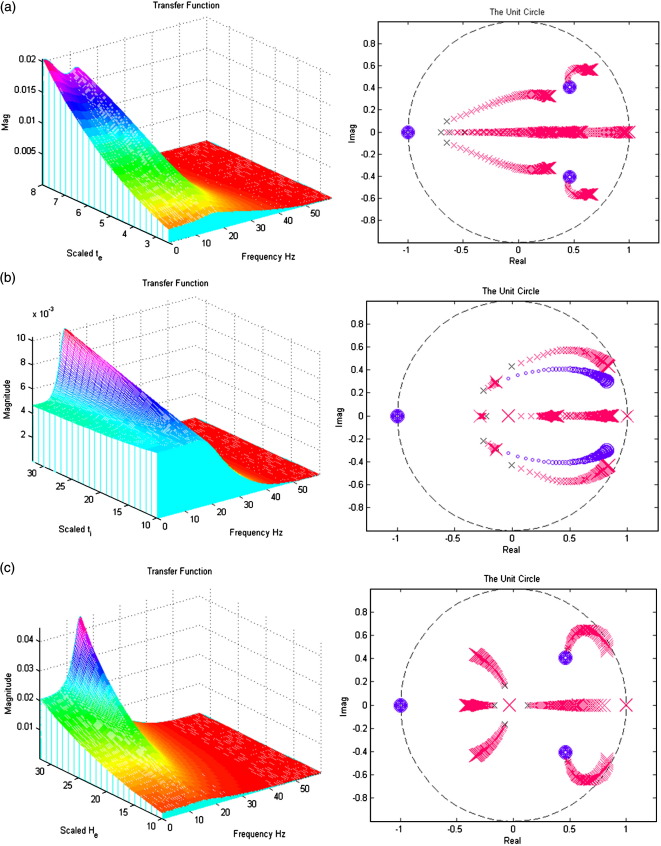
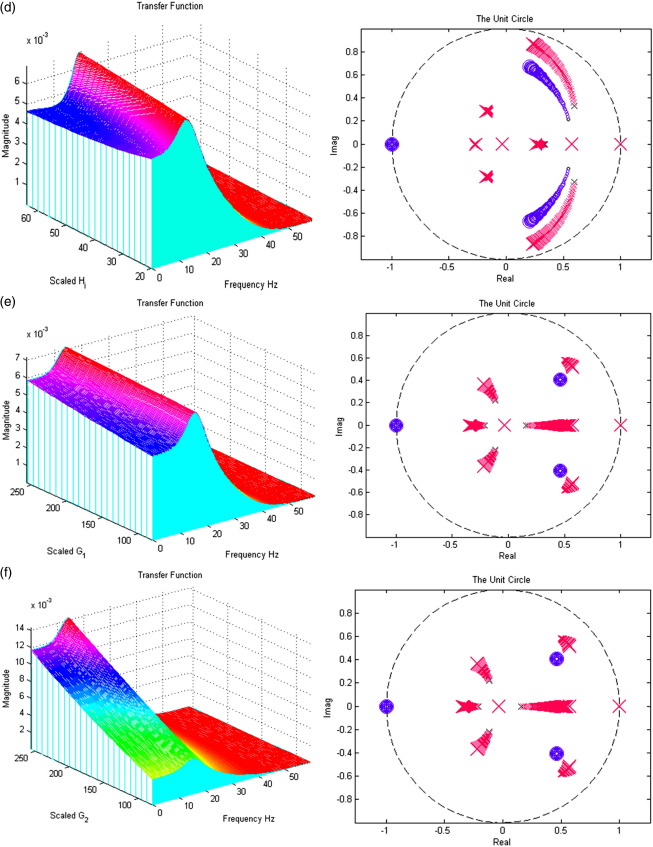
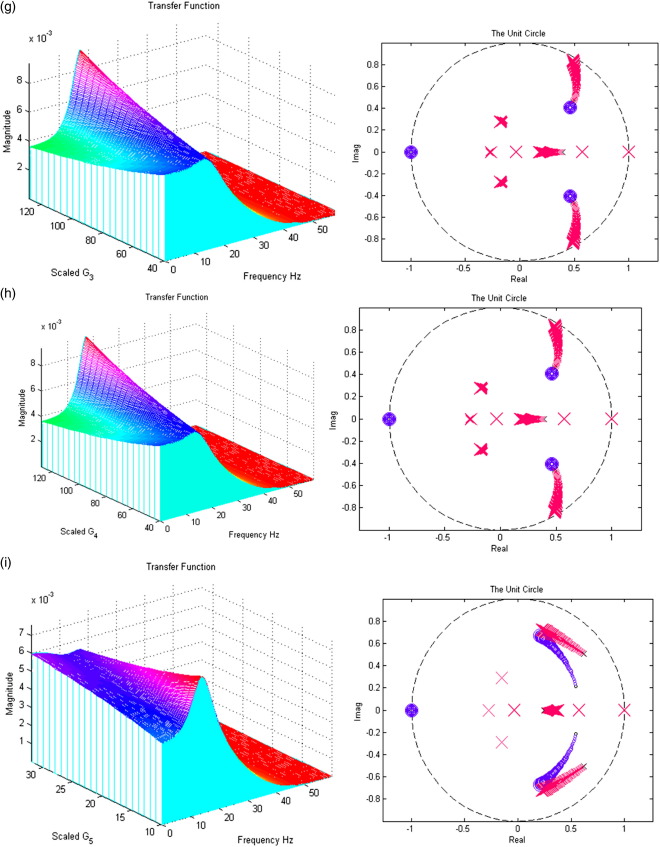
Fig. 7.
(a) The effect of variable excitatory time constant τe. (b) The effect of variable inhibitory time constant τi. (c) The effect of variable maximum excitatory postsynaptic potential He. (d) The effect of variable maximum inhibitory postsynaptic potential Hi. (e) The effect of variable pyramidal–pyramidal connection strength γ1. (f) The effect of variable stellate–pyramidal connection strength γ2. (g) The effect of variable pyramidal–inhibitory interneurons connection strength γ3. (h) The effect of variable inhibitory interneurons–pyramidal connection strength γ4. (i) The effect of variable inhibitory–inhibitory connection strength γ5.


