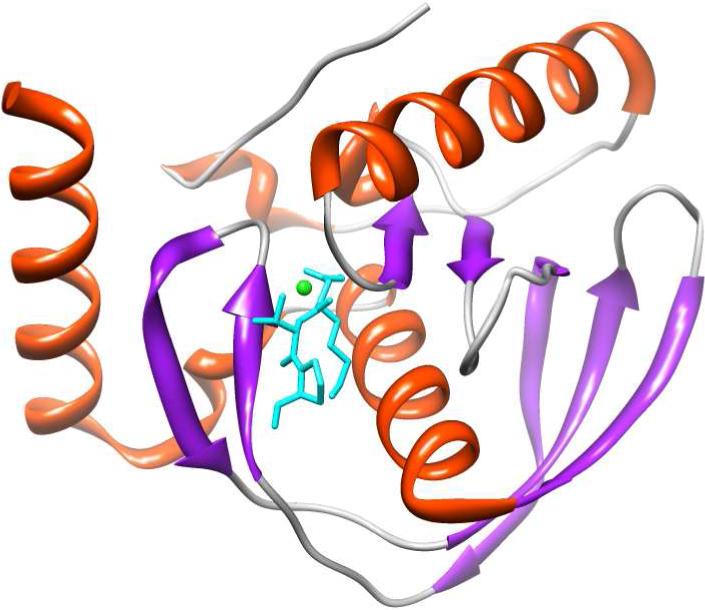
Figure 1.

Structural depiction of E. coli PDF in complex with actinonin (PDB ID: 1G2A) as determined by Clements et al. (20). Actinonin is shown in cyan and the bound Ni2+ is depicted in green. The structural depiction of PDF was produced using the UCSF Chimera modeling package (21) from the Resource for Biocomputing, Visualization, and Informatics (University of California, San Francisco; supported by NIH P41 RR-01081).
