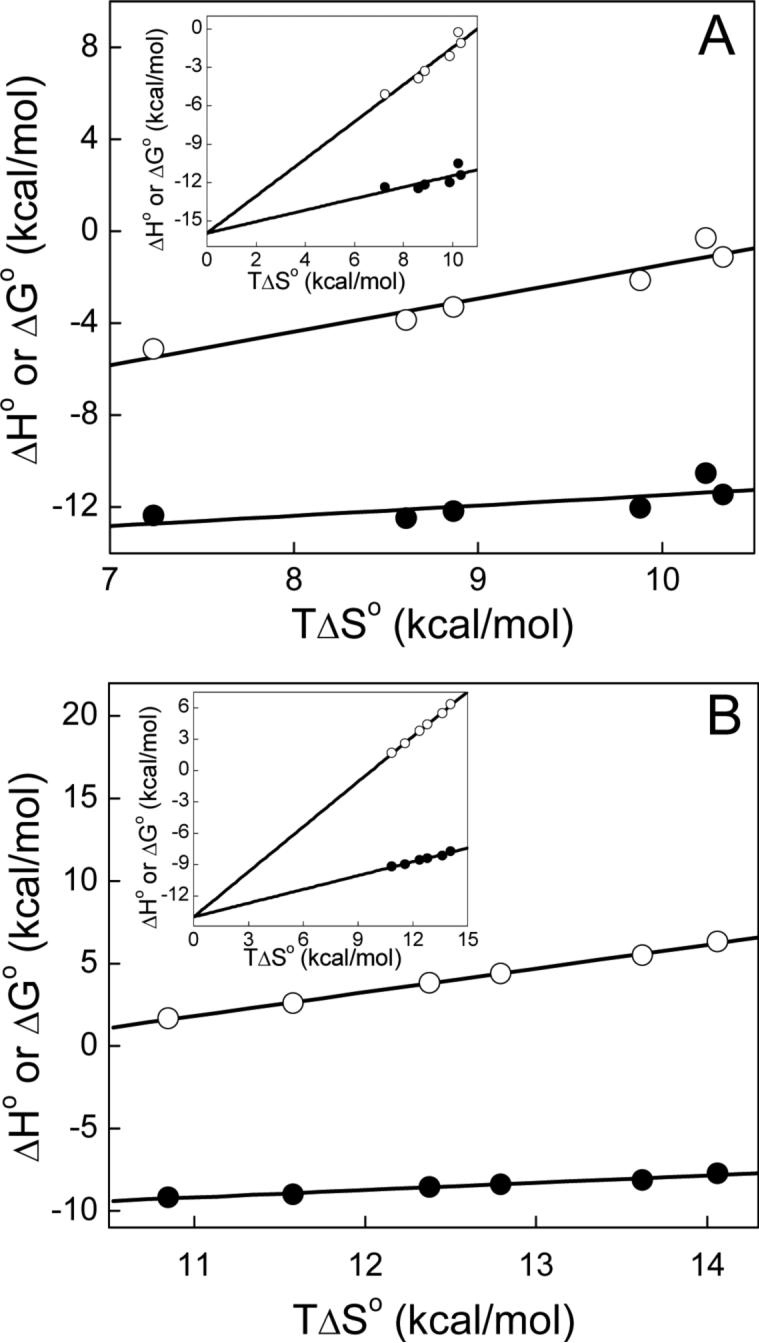
Figure 4.

Enthalpy-entropy compensation plots for the binding of actinonin to Ni2+-substituted PDFEc in 50 mM potassium phosphate, pH 7.0 containing 1 mM NiCl2. The thermodynamic parameters were obtained as described in Figure 2 as well as in the text with panel A depicting the higher-affinity site parameters and panel B depicting those of the lower-affinity site. The dependence of ΔG° and ΔH° on TΔS° is shown by closed and open circles, respectively, and the solid lines represent linear regression analysis of the plotted data. For the higher-affinity site slopes and Y-axis intercepts are 0.45 ± 0.2 and −16.0 ± 1.9 for ΔG° and 1.45 ± 0.2 and −16.0 ± 2.0 kcal mol−1 for ΔH° and those of the lower-affinity site are 0.44 ± 0.03 and −14.0 ± 0.4 for ΔG° and 1.44 ± 0.032 and −14.0 ± 0.4 kcal mol−1 for ΔH°, respectively. Insets depict the mutual intersection of the fitted lines at the Y-axis.
