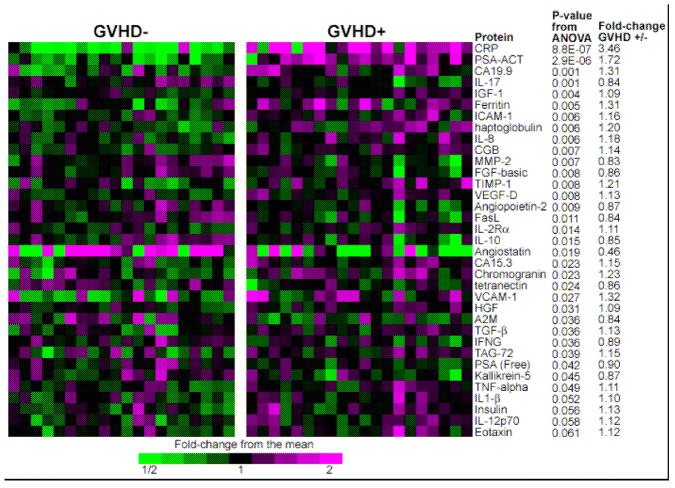
Fig 1. Antibody array heatmap of discovery set samples.
This heatmap depicts relative protein values obtained from antibody microarrays after removal of batch effects due to three separate analyses. Samples from 21 GVHD–patients (left panel) and 21 GVHD+ patients (right panel) are represented. Only the antibodies giving the 35 smallest p-values for differences between GVHD+ and GVHD– patient plasma are shown. P-values compare GVHD+ and GVHD–samples. Reproduced with permission from reference 31.

