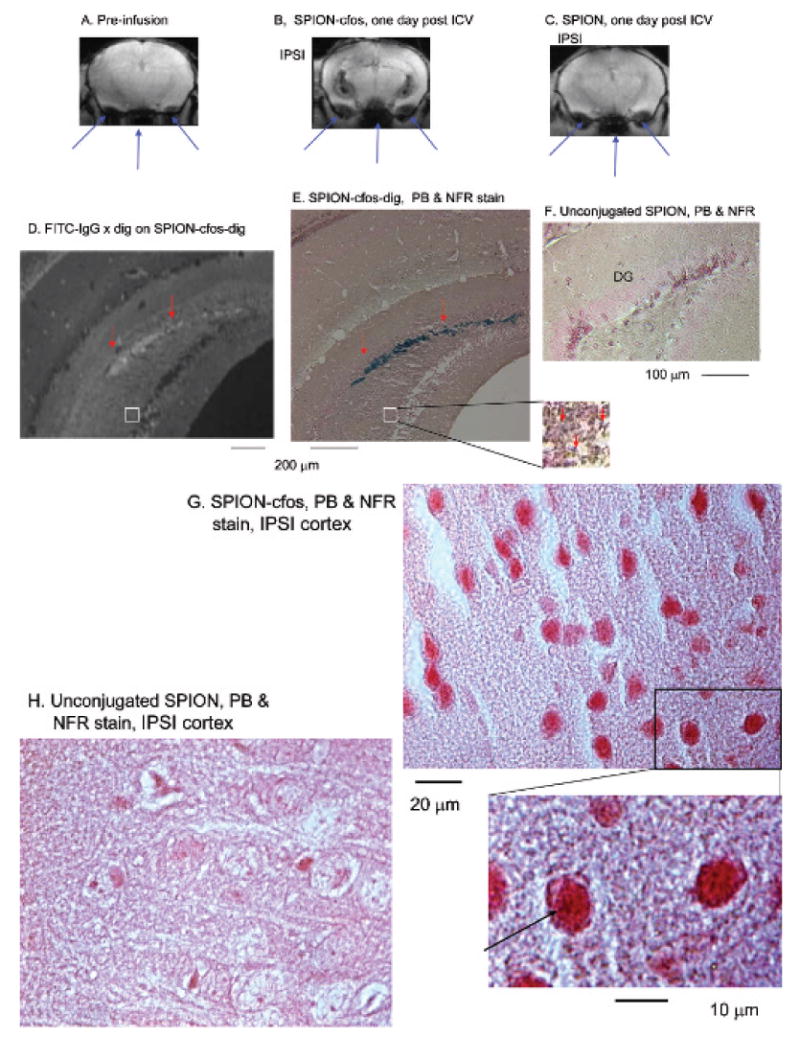
Figure 4.

Colocalization of single-stranded phosphorothioate-modified oligodeoxynucleotide (sODN)-cfos and iron oxide in the ipsilateral hippocampus of a mouse 1 day after infusion of SPION-cfos. Animals were infused with SPION-cfos-digoxigenin (Fe = 0.08 mg/kg, n = 3). A to C show T2*-weighted images of preinfusion baseline, SPION-cfos-digoxigenin, and SPION-infused brains 1 day after infusion in live animals. Long arrows (pointed upward) point to the tissue-air interface from the trachea and ears. Images were produced using a 9.4 T magnetic resonance imaging (MRI) system. Histology of SPION uptake was acquired in postmortem brain samples after MRI. These brain sections were 10 μm in thickness. D shows fluorescein isothiocyanate (FITC)-antidigoxigenin antibodies (white fluorescent staining) on cfos-digoxigenin in the dentate gyrus (DG). Iron oxide was detected in a similar area of the adjacent brain section using Prussian blue (PB) stain and nuclear fast red (NFR) counterstain (E–H). F shows the PB stains of the SPION-infused brain sample. Short arrows (pointed down) indicate colocalization of iron oxide detected by PB stain. G and H show the cortices. ICV = intracerebroventricular; IPSI = ipsilateral to the infusion site.
