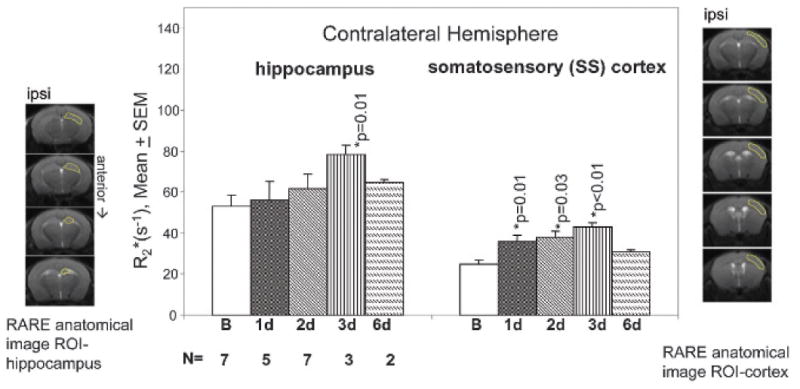
Figure 5.

In vivo R2* profile in two contralateral brain regions of the brain. Regions of interest (ROI) were outlined in the panels to the left (hippocampus) and right (somatosensory [SS] cortex) of the bar graph. Progressive elevation of R2* in both brain regions was observed for 3 days. Hippocampal regions reached plateau at 3 days (p = .01), whereas the SS cortex exhibited significant elevations at 1, 2, and 3 days (p ≤ .03). R2* values in both regions decreased to the baseline on day 6, suggesting washout (clearance) of the probe. SEM = standard error of measurement.
