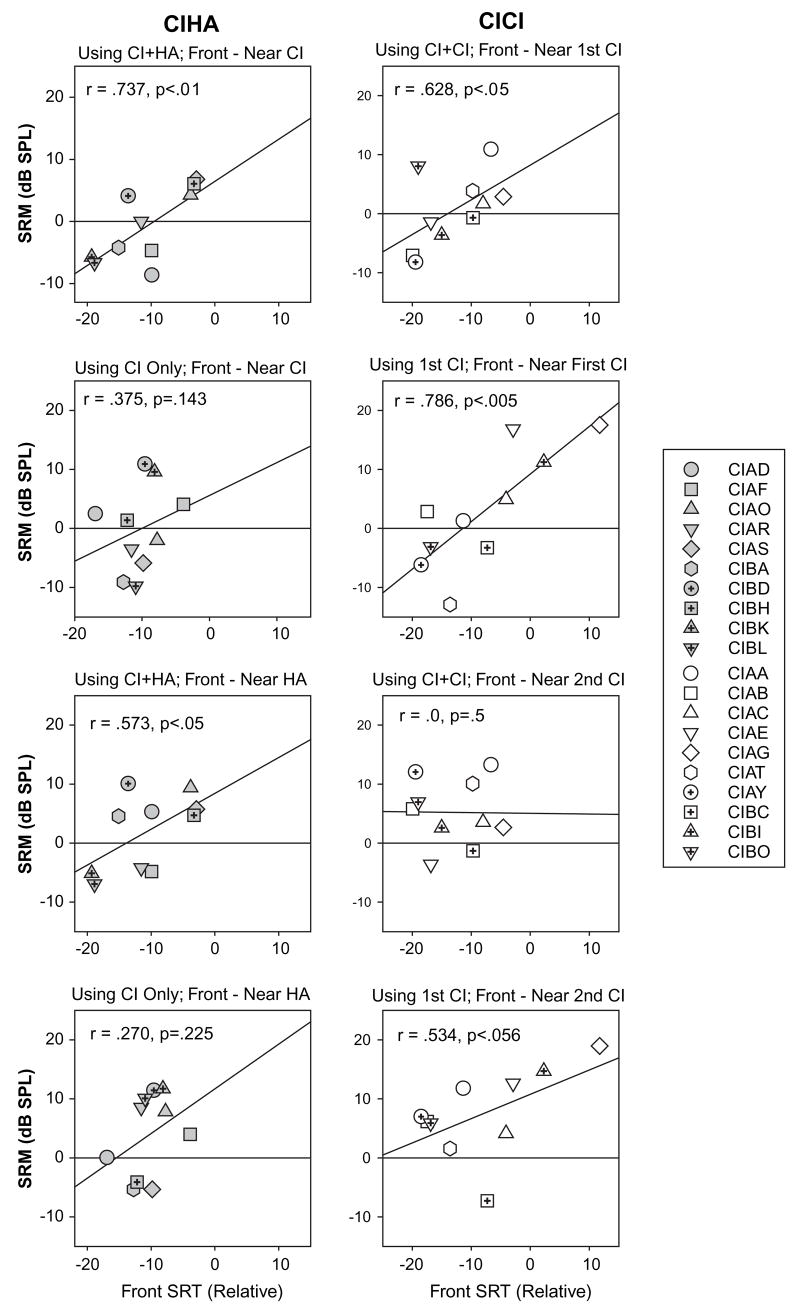
Figure 5.
Correlations are shown for SRM values and SRTs obtained in the front (non spatial) condition. Results are shown separately for the CI-CI (right) and CI-HA group (left). Each panel contains values obtained for different listening conditions, when the children were using either both or one device, and when the competing speech was either near the first CI or on the other side. The exact condition is indicated in the text above each graph, and results from the correlation values are indicated within each plot.

