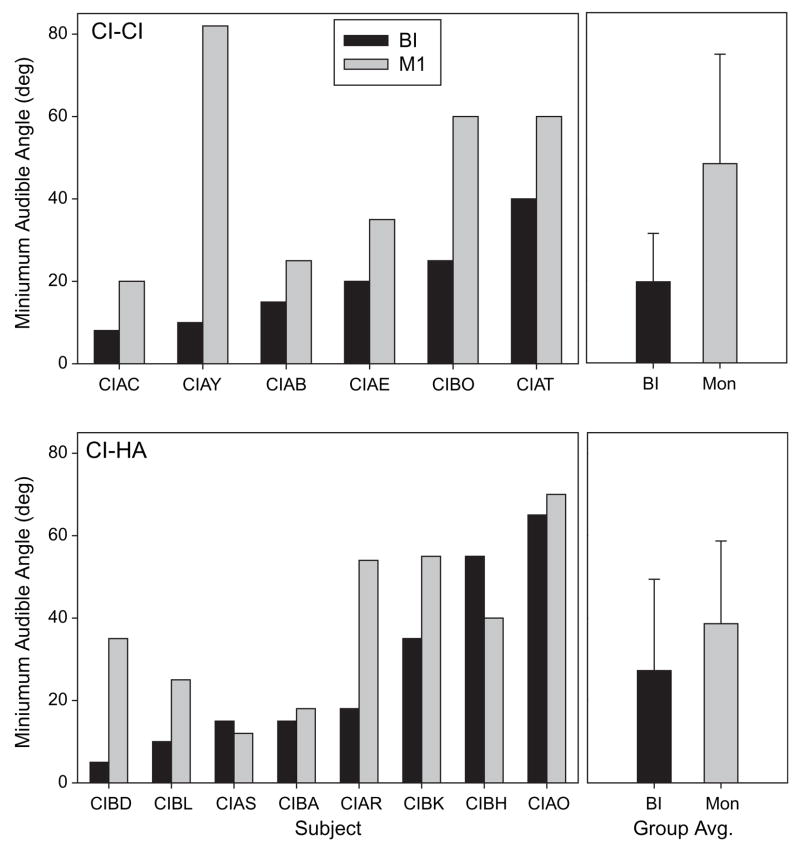
Figure 6.
MAA values are shown for individual children on the left, and group means (± SD) on the right. Values are compared for monaural (gray fill) and bilateral (black fill) listening modes. Results are shown separately for the CI-CI group (top) and CI-HA group (bottom). Subject codes are indicated below each graph.

