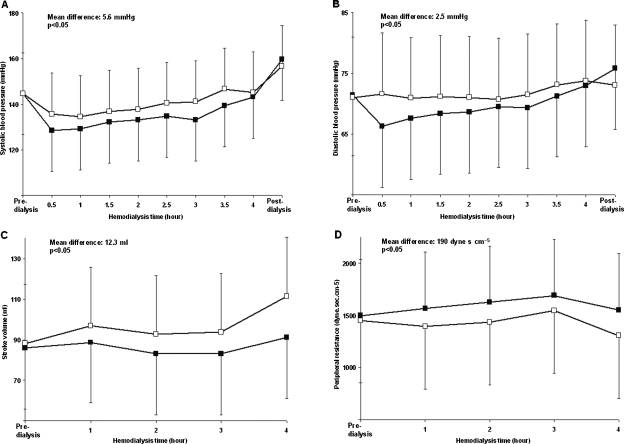
Fig. 3.
Panels A–D: Haemodynamic consequences of changing the calcium concentration in dialysis fluids. Systolic (Panel A) and diastolic (Panel B) pressure, stroke volume (Panel C) and peripheral resistance (Panel D) as a function of the haemodialysis time using a dialysate ionized calcium concentration of 1.25 (black squares) and 1.50 (empty squares) mmol/l, respectively. The mean differences between the curves and the statistical significances are superimposed in the figures.

