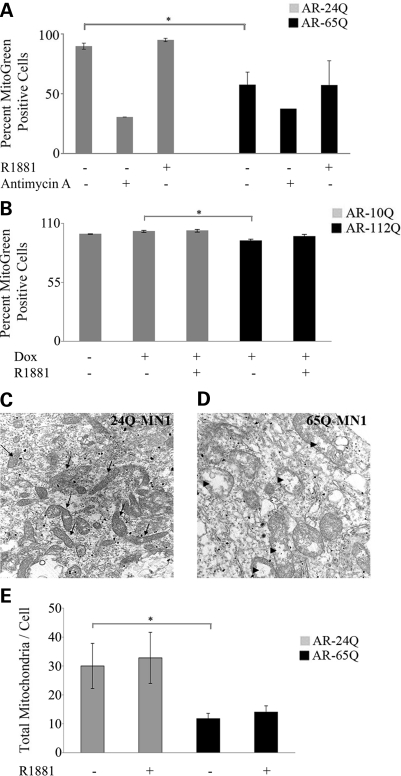
Figure 2.
Reduced mitochondrial mass and number in cells expressing mutant AR. (A) AR-24Q and AR-65Q MN-1 cells and (B) differentiated AR-10Q and AR-112Q PC12 cells left uninduced or induced to express AR were treated with vehicle or the mitochondrial toxin, antimycin A for 48 h. The cells were then stained with a fluorescent marker and mitochondrial mass was analyzed by flow cytometry. AR-65Q (A) and AR-112Q cells (B) have ligand-independent decrease in mitochondrial mass. The data in both panels were normalized to the respective vehicle treated normal cells (set as 100%). Shown are the mean ± standard error of three experiments; *P ≤ 0.05. (C and D) Representative high magnification (10 000×) electron micrographs of AR-24Q (C) and AR-65Q MN-1 (D) cells exposed to vehicle for 24 h. The micrographs show more mitochondria (arrows in B) in AR-24Q compared to AR-65Q cells. The AR-65Q cells have vesiculated cristae (arrowheads in D). (E) The total number of mitochondria was counted in 10–12 cells per sample. The error bars indicate SEM; *P ≤ 0.05.

