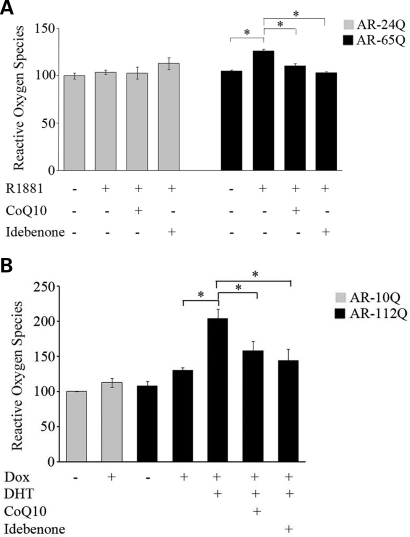
Figure 4.
Mutant AR increases ROS (A) AR-24Q and AR-65Q MN-1 cells and (B) differentiated AR-10Q and AR-112Q PC12 cells induced to express AR were exposed to vehicle alone, ligand (R1881 or DHT) and CoQ10 or idebenone. ROS levels were measured with a fluorometric assay and are indicated relative to vehicle-treated AR-24Q cells (A) or vehicle-treated cells induced to express AR-10Q (B) (assigned as 100%). In both mutant MN-1 (A) and PC12 (B) cells, ROS levels increased with ligand and co-enzyme Q10 and idebenone blocked this increase. The graph shows representative results of one of the three independent experiments in (A), and the average of three experiments in (B), which were each done in triplicate. The error bars indicate the SEM; *P ≤ 0.05.

