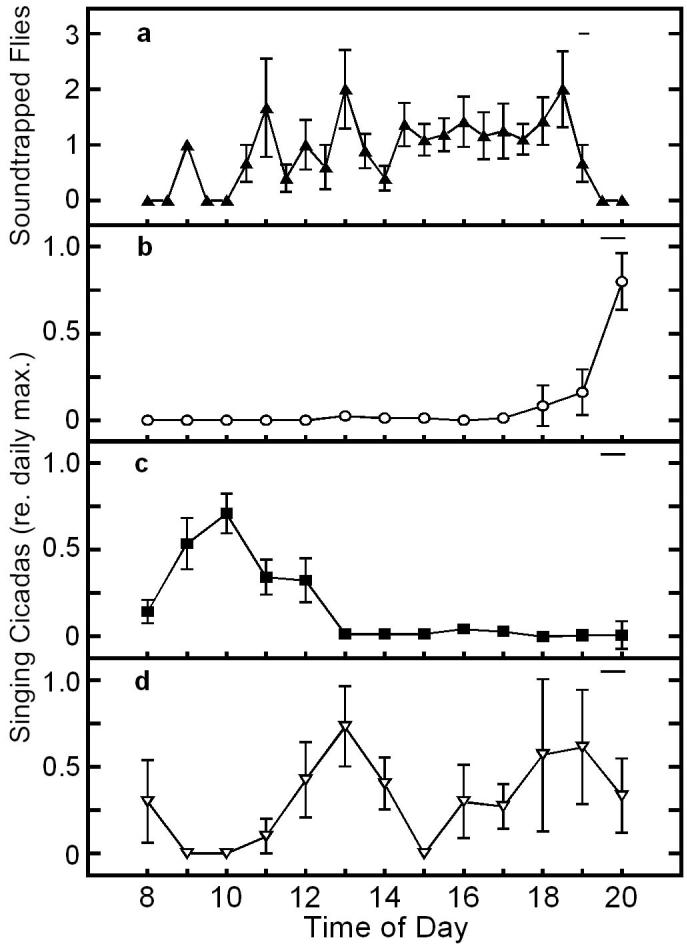
Figure 2.

a Mean (±S.D.) number of flies trapped at the continuous broadcast of a model T. pruinosa calling song at half-hour intervals on two different days (n = 44 flies). b-d Arithmetic mean proportion (±S.D.) of singing cicadas (b T. pruinosa; c T. chloromera; d N. hieroglyphica) relative to the time of day. No census was taken from 2100 to 0700 hrs.. Solid horizontal lines represent the range of sunset times for the data.
