
Figure 3.
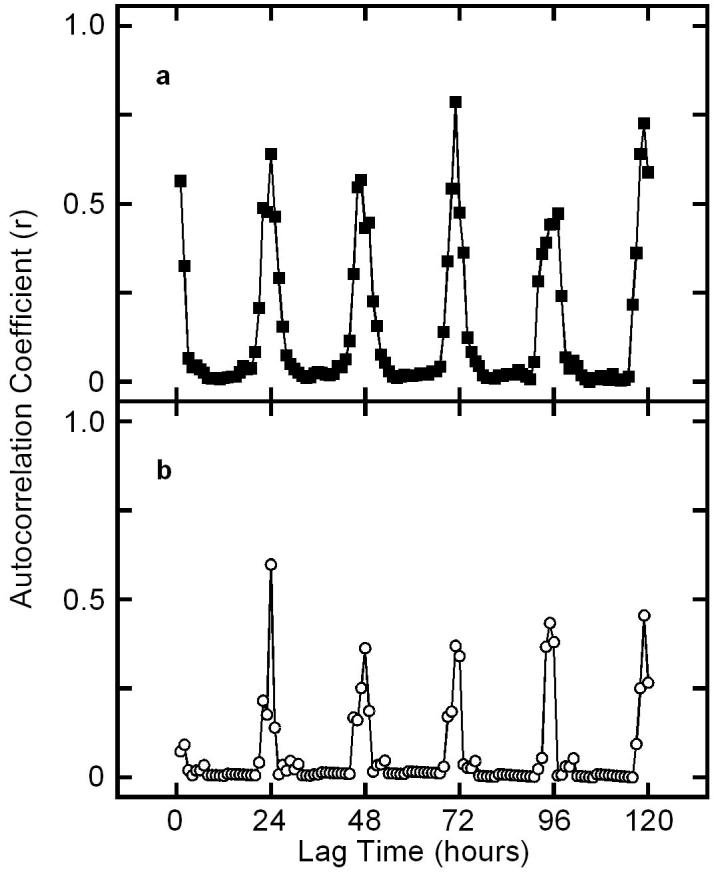
Correlograms of the time series data for diel calling in a) T. chloromera and a) T. pruinosa. Each point represents the autocorrelation coefficient for each 1 hour lag of the first 120 hours of the observations (lags begin at 1 hr). The ten days of census were combined to form a continuous time series. To complete the 24 hours of observations, census levels of 0 were given to the hours of 2100 to 0700, when no cicadas called. Autocorrelation coefficient (r) values are greatest at a period of 24 hours for both species.