
Figure 6.
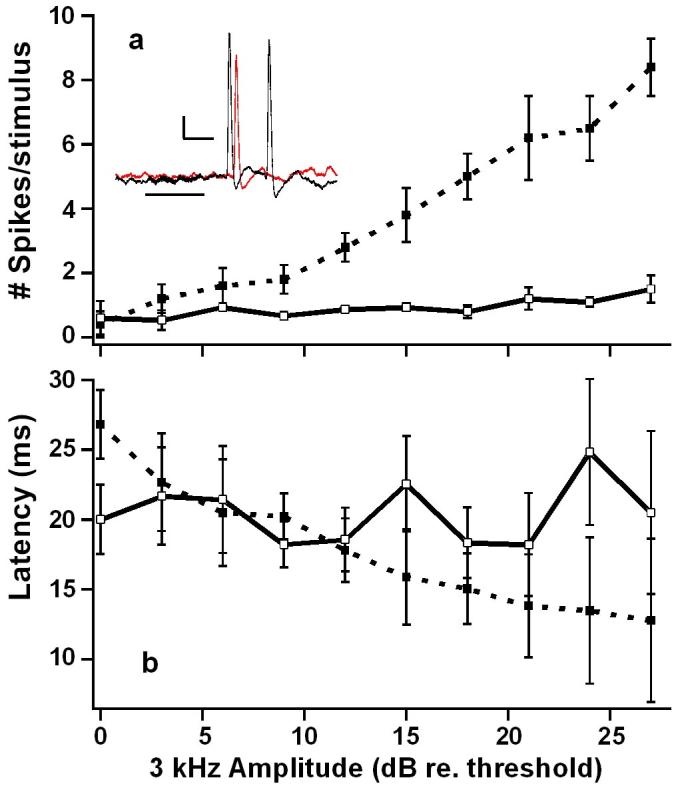
Input / Output curves for 3 kHz stimuli. Mean (±S.D.) number of spikes (a) and latency (b) to first spike. Open and closed symbols are data from interneurons (n = 5) and afferents (n = 1), respectively. Inset: example of interneuron response to varying stimulus amplitude. Stimulus is a 20 ms pulse of 3 kHz at 71 dB SPL (red) and 95 dB SPL (black). Horizontal bar represents stimulus time. Scale: 10 mV, 10 ms.