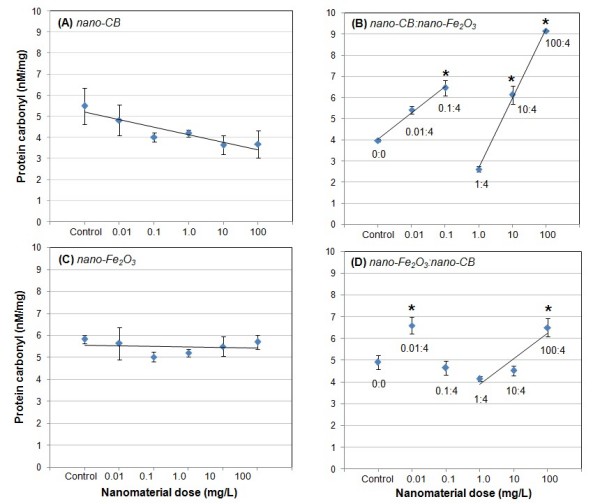
Figure 3.

Protein carbonyl concentrations in A549 cells after 25 hours of exposure to (A) carbon black nanoparticles alone, (B) carbon black nanoparticles and Fe2O3 nanoparticles, (C) Fe2O3 nanoparticles alone, and (D) Fe2O3 nanoparticles and carbon black nanoparticles. Numbers within the co-exposure graphs denote doses of the two materials. "Nanomaterial dose" refers to the concentration of the nanoparticles in the cell culture medium. Values given are means ± SD (*p < 0.05 relative to control cell population).
