
Figure 2.
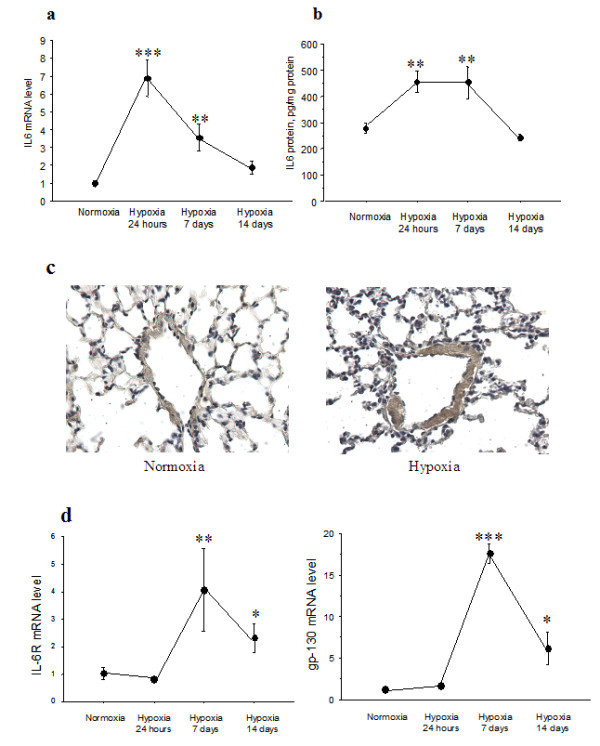
expression and immunolocalization of interleukin-6 in lungs from IL-6+/+ mice after hypoxia exposure. IL-6 mRNA levels in total lung tissue determined by real-time quantitative RT-PCR (a) and protein levels assessed by ELISA (b). Each point is the mean ± SEM of at least 8 determinations after exposure to 10% O2 for 24 hours, 1 week, or 2 weeks. **P < 0.01, ***P < 0.001 compared with values in normoxic mice. IL-6 immunostaining in lung sections from IL-6+/+ mice under normoxia (c, left panel) and after hypoxia exposure for 7 days (c, right panel). Strong IL-6 immunostaining is visible in vessel walls from the animal exposed to hypoxia (arrows). IL-6R and gp-130 RNA expression in total lung tissue from IL-6+/+ mice exposed to hypoxia (d). Each point is the mean ± SEM of at least 8 determinations after exposure to 10% O2 for 24 hours, 1 week, or 2 weeks. *P < 0.05, **P < 0.01, ***P < 0.001 compared to values in normoxic animals.