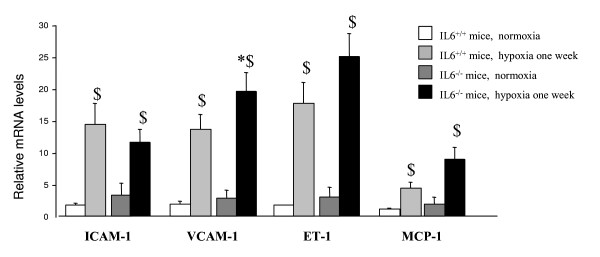
Figure 5.
Lung expression of ICAM-1, VCAM-1, ET-1 and MCP-1 mRNAs in IL-6-/- and IL-6+/+ during normoxic and hypoxic conditions. Levels of ICAM-1, VCAM-1, ET-1, and MCP-1 mRNAs in lung tissue from IL-6+/+ and IL-6-/- mice after normoxia or 1 week of hypoxia. Each bar is the mean ± SEM (n = 5 in each group). *P < 0.05 and **P < 0.01 compared with corresponding values in wild type mice. $P < 0.05 and $$P < 0.01 compared with corresponding values under normoxia.

