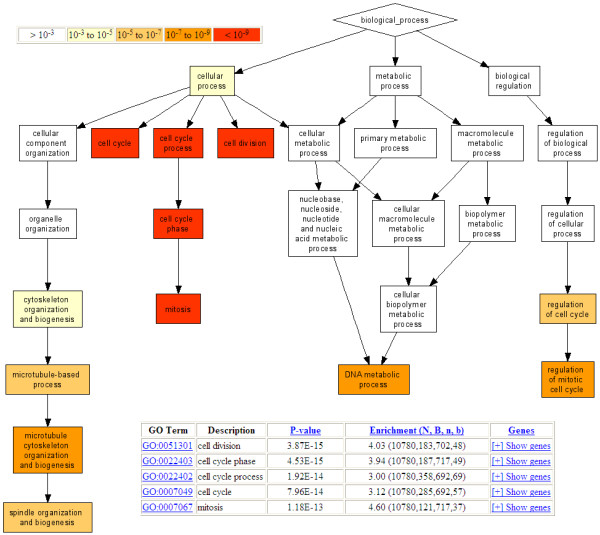
Figure 2.

An example of the GOrilla analysis output. 14,565 genes from the van't Veer dataset were ranked according to their differential expression and given as input to GOrilla. The resulting enriched GO terms are visualized using a DAG graphical representation with color coding reflecting their degree of enrichment. Nodes in the graph are clickable and give additional information on the GO terms and genes attributing to the enrichment. N is the total number of genes; B is the total number of genes associated with a specific GO term; n is the flexible cutoff, i.e. the automatically determined number of genes in the 'target set' and b is the number of genes in the 'target set' that are associated with a specific GO term. Enrichment is defined as (b/n)/(B/N).
