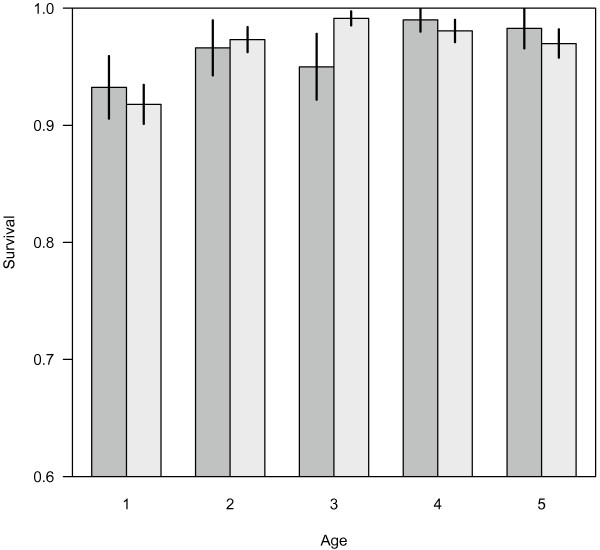
Figure 4.
Estimated age-specific juvenile survival rates, as a function of whether or not the grandmother is alive. Dark bars represent animals whose grandmothers are known to be dead, light bars represent animals whose grandmothers are known to be alive (lines represent standard errors), complete sample sizes in Tables 1–2.

