
Figure 1.
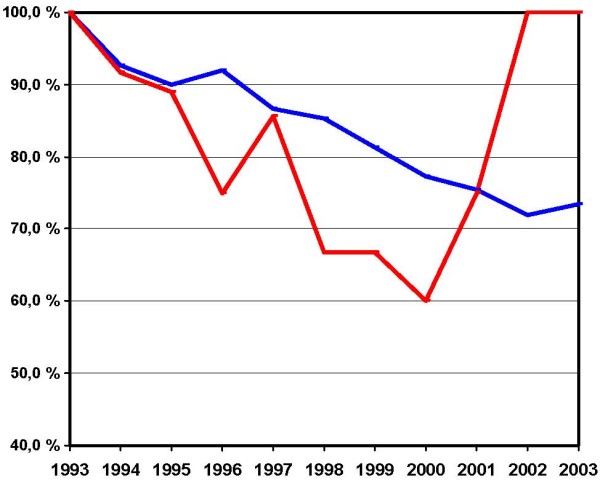
Postoperative employment status at the end of each calendar year. A 10-year follow-up of originally 141 patients, who were working one year postoperatively and remained under 60 during the follow-up. Deceased persons, altogether eight, are excluded. X-axis: Calendar years. Y-axis: Percentages of patients working at the end of each calendar year. Blue line: men, red line: women