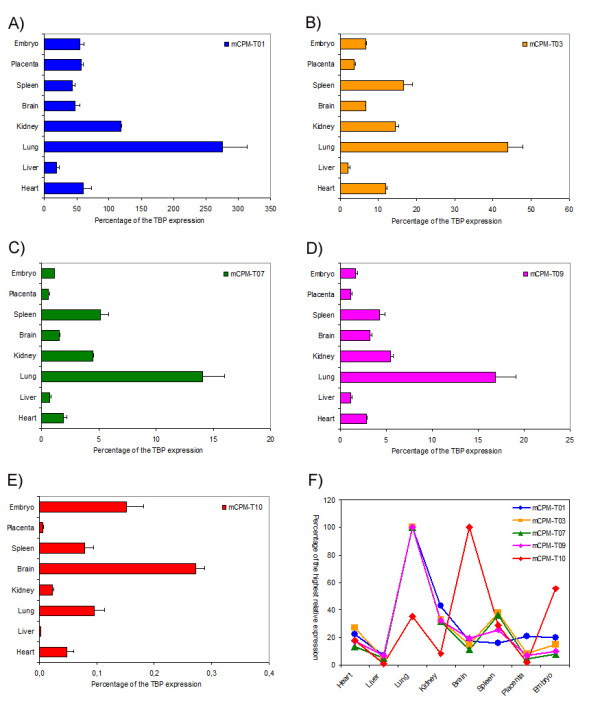
Figure 4.

Expression analysis of some mouse CPM locus transcripts. The level of expression in mouse organs and embryos of five mouse CPM locus transcripts (mCPM-Ts) is shown in panels A to E. The expression levels of mCPM-Ts were calculated as the mean relative expression value of three independent samples and presented as percentage of the respective mean TBP gene expression on these three samples. A comparison of the analysed mCPM-Ts pattern of expression in the indicated mouse organs and embryo is presented as a percentage of the highest relative expression in panel F.
