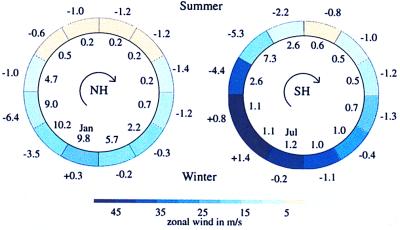
Figure 2.
Seasonal cycle in the lower-stratospheric polar vortex in the NH (Left) and SH (Right). Colored ring indicates the strength of the zonal wind at 50 hPa averaged from 50–70° latitude (ms−1). The outside ring of numbers indicates the 18-year temperature trend from MSU-4 data (93) averaged over the polar cap (60–90°) (units °K/18 years). The inside ring of numbers indicates the daily variability of the 50-hPa height field averaged over the polar cap (104 m2).

