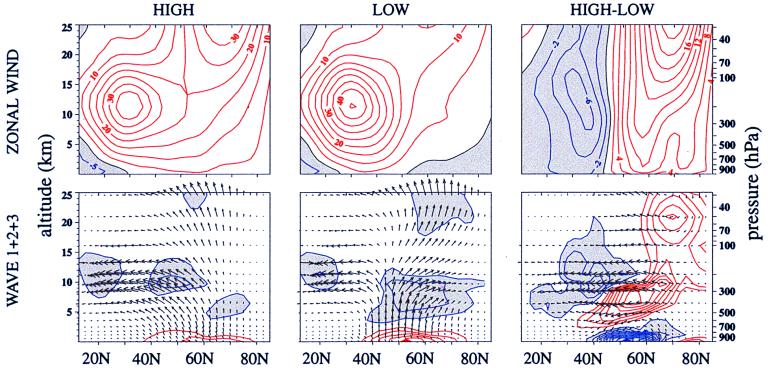
Figure 3.
Composites for periods of high and low NAM index and their difference (Left, Center, and Right) during the December–March period. The zonal wind composites are on the top (units are ms−1). The EP flux cross sections for the sum of zonal wavenumbers 1 to 3 are on the bottom. Positive contours are red.

