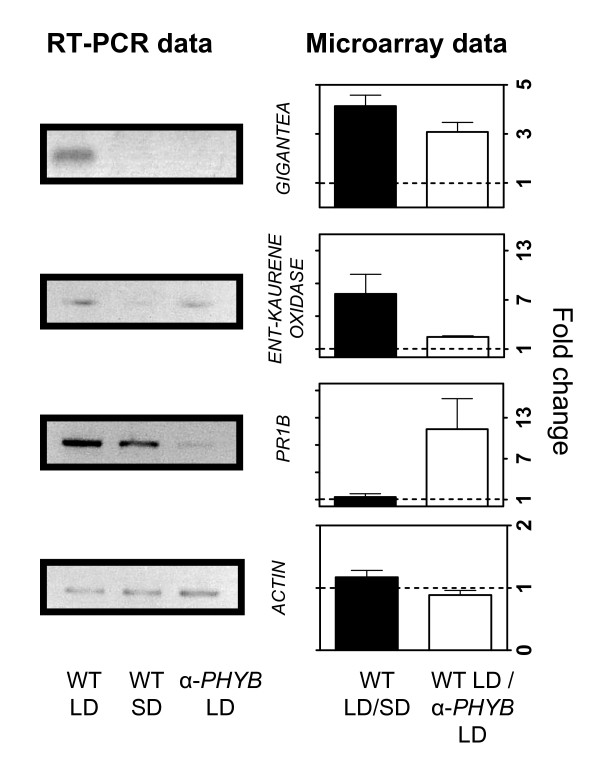
Figure 4.
RT-PCR and microarray expression data of selected genes showing different patterns of phyB and photoperiodic regulation of expression. The expression of GIGANTEA, ENT-KAURENE OXIDASE, PR1B and ACTIN was analyzed by RT-PCR in wild-type plants grown under LD or SD conditions, as well as in α-PHYB grown under LD. RT-PCR data is shown on the left panels and the corresponding microarray data for each gene is displayed on the right panels.

