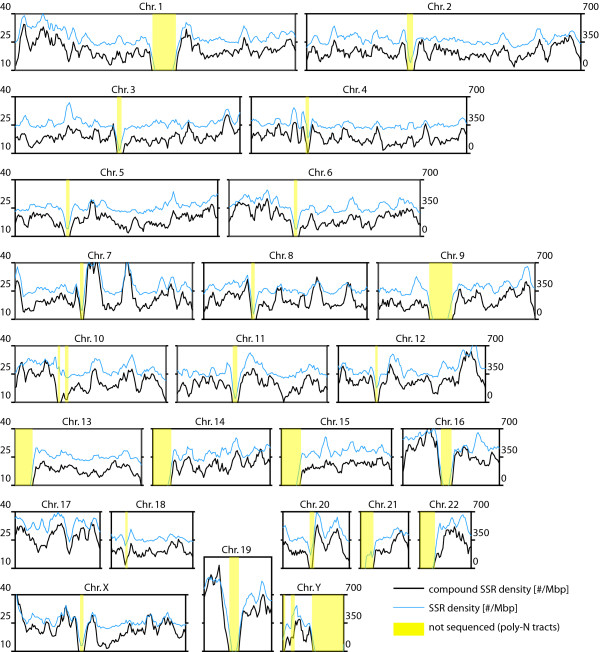
Figure 2.
Compound microsatellite density in the chromosomes of H. sapiens compared to the microsatellite density. Regions which have not yet been sequenced are designated yellow. The scale of the compound microsatellite density is on the left hand side and the scale of the SSR density on the right hand side. The SSR and the compound microsatellite density were calculated with an sliding window approach using a window size of 5 Mbp and a step size of 1 Mbp.

