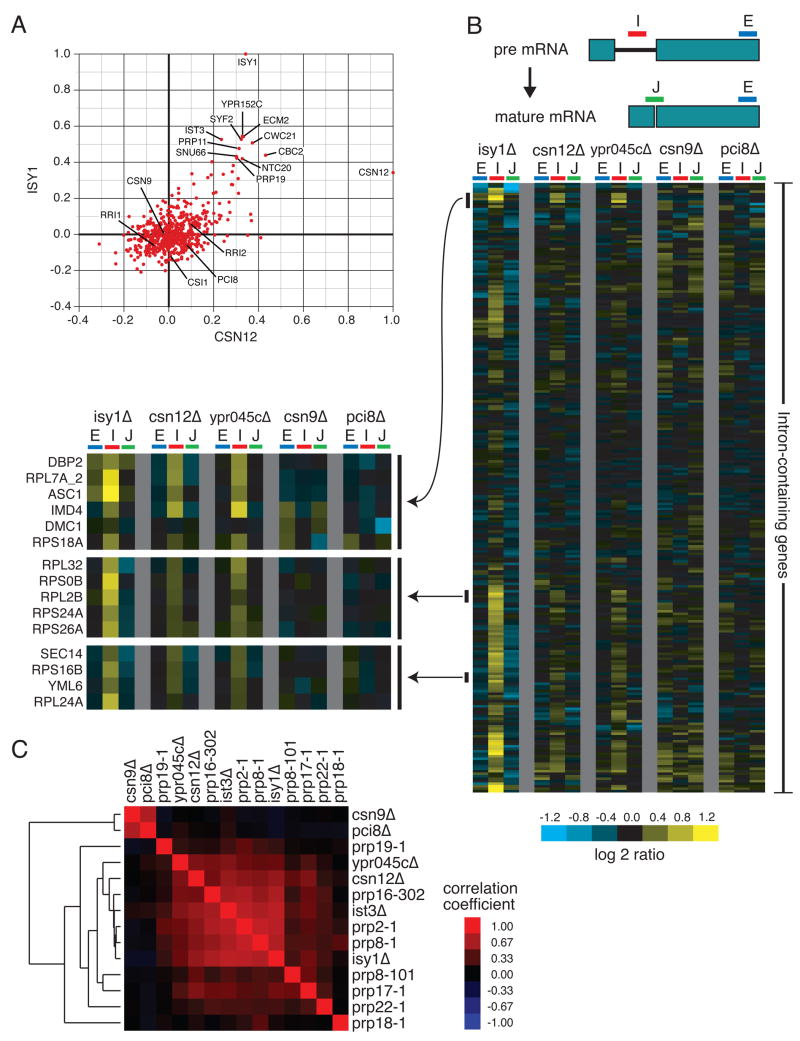
Figure 4. Csn12 is involved in mRNA splicing.
(A) Plot of correlation coefficients generated from comparison of the genetic interaction profiles from csn12Δ or isy1Δ to all other profiles in the E-MAP. B) Splicing-specific microarray profiles for several mutant strains. The schematic displays the positions of the microarray probes that report specifically on the levels of pre-mRNA (in the Intron), mature mRNA (at the Junction), and total mRNA (in the second Exon) for each intron-containing transcript. The relative levels of exon, intron, and junction for a single intron-containing gene are displayed as log2 ratios for the indicated mutant strains compared to a wild type strain, across each row. The ordering of genes was determined by hierarchical clustering. For selected clusters of genes, the splicing profiles across the mutants tested are displayed at higher resolution to the left of the full splicing profiles. C) Pairwise Pearson correlation coefficients were calculated between each of the mutants tested, as well as between these mutants and several previously characterized splicing mutants. The matrix of correlations was subjected to hierarchical clustering.

