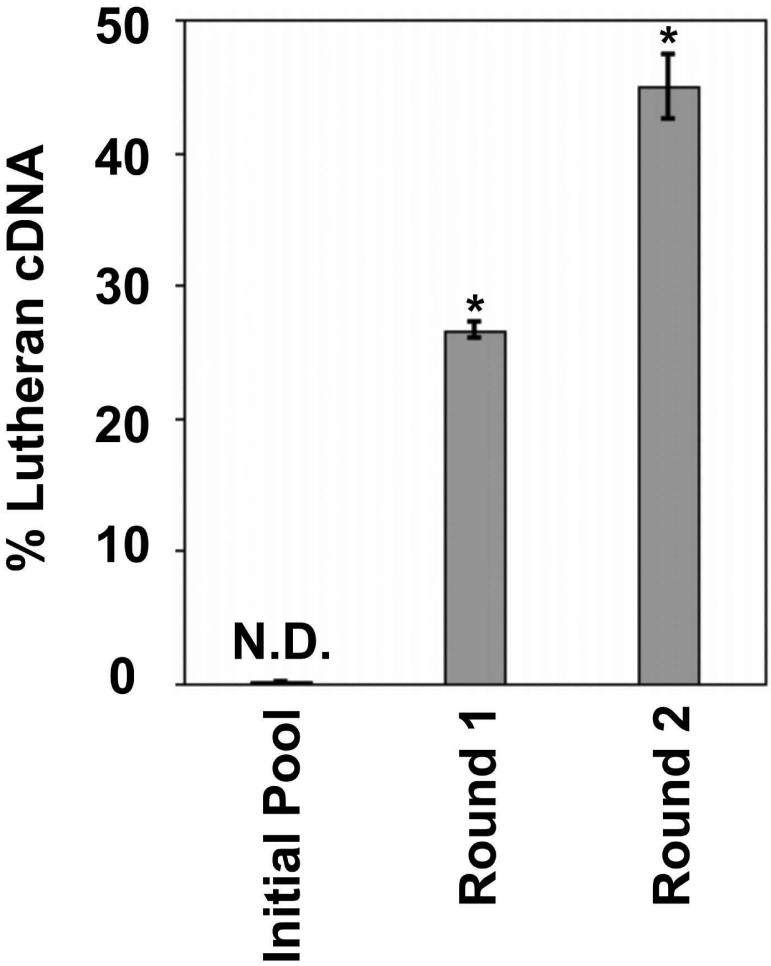
Figure 3.
Quantitative agarose gel analysis results for MEC enrichment of Lutheran glycoprotein-encoding cDNA from a 1:1000 dilution with no-insert PCDNA1.1. Error bars denote SEM for 4 independent agarose gel analyses each; N.D. = Not Detected; * = p<0.05 compared to previous round as determined by a two-tailed Student's t-test.

