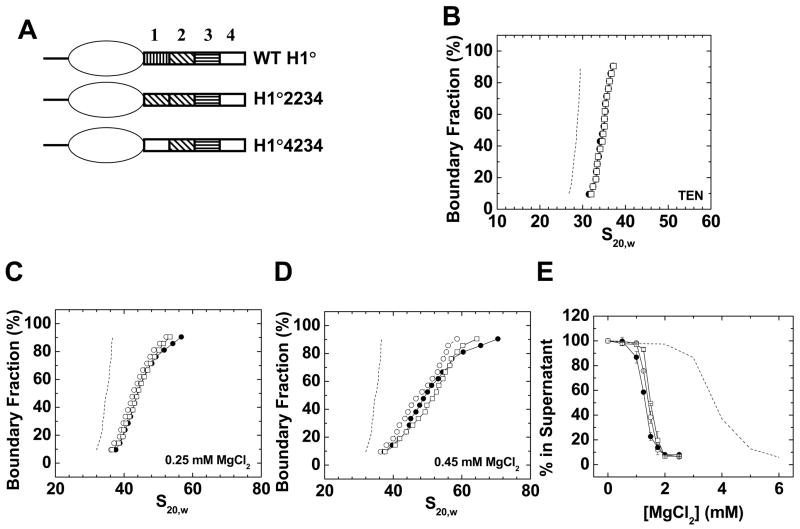
Figure 5. Replacement of H1° CTD region 1 with regions 2 or 4.
A) Schematic diagrams of wild type H1°, H1°2234, and H1°4234. B) Sedimentation coefficient distributions in low salt TEN buffer of 208–12 nucleosomal arrays (dashed line) assembled with wild type H1° (○), H1°2234 (●), or H1°4234 (□). C) Sedimentation velocity analysis. G(s) plots of 208–12 chromatin fibers bound to wild type H1° (○), H1°2234 (●), or H1°4234 (□) in 0. 25 mM MgCl2. The G(s) plot of H1°-bound chromatin fibers in low salt (dashed line; data from panel 1A) is shown for reference. D) G(s) plots of 208–12 fibers bound to wild type H1° (○), H1°2234 (●), or H1°4234 (□) in 0. 45 mM MgCl2. The G(s) plot of H1°-bound chromatin fibers in low salt (dashed line; data from panel 1A) is shown for reference. E) Oligomerization as a function of MgCl2. Shown are data for 208–12 nucleosomal arrays (dashed line) and 208–12 chromatin fibers bound to wild type H1° (○), H1°2234 (●), or H1°4234 (□). All plots are representative of results seen with 3–4 different chromatin preparations.

