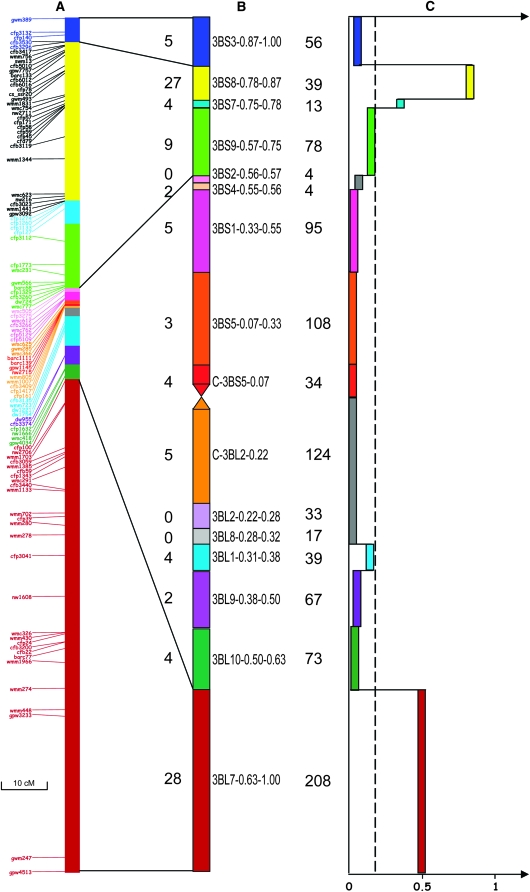
Figure 1.—
Distribution of COs along chromosome 3B. (A) Genetic map of chromosome 3B. Markers are indicated with the same color code as for the deletion bins. (B) Deletion map of chromosome 3B. The deletion bins used to assign markers are represented with the number of markers in each bin (left of the chromosome) and the size of the bin in megabases (right). (C) Schematic representation of the CO frequency along chromosome 3B. CO frequency calculated in centimorgans per megabase is represented by a colored bar for each bin. The two gray bars indicate bins with no markers that were grouped together. The plotted lines represent the average CO frequency for the chromosome.

