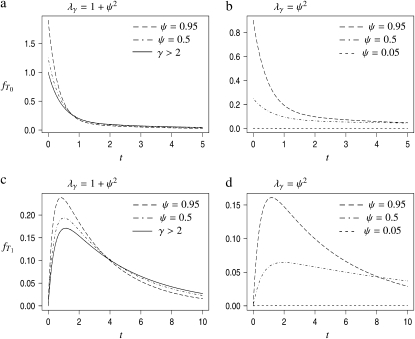
Figure 1.—
The densities  and
and  of times to coalescence for two genes sampled from the same (T0), or different (T1), subpopulations as functions of time for different values of ψ when the number of subpopulations D = 3 and φ = κ = 1. The coalescence timescale is N2/2 in a and c and Nγ/2 with 0 < γ < 2 in b and d. The solid lines in a and c are the densities obtained under the standard coalescent (i.e., γ > 2).

