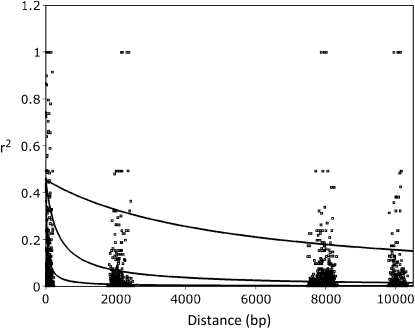
Figure 5.—
Rapid decay of LD in Australian zebra finches. Point estimates represent empirical r-squared values from pairwise comparisons among sites. Curves represent predictions of the decay of LD based on equation 3 from Weir and Hill (1986). The top solid line is based on ρ estimated from humans (0.0004), the bottom line is the multilocus average estimated using PHASE (ρ = 0.051), and the middle line is based on the minimum point estimate of ρ estimated by PHASE (ρ = 0.006).

