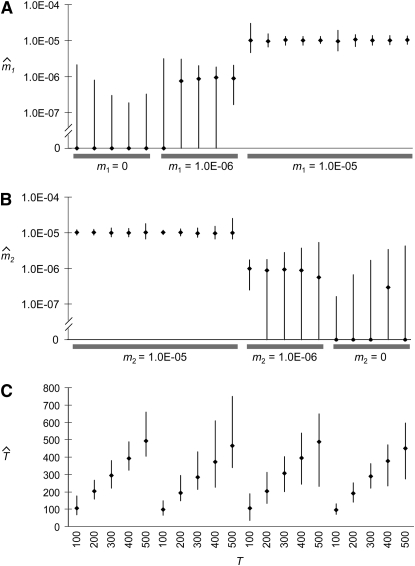
Figure 3.—
Distribution of demographic parameter estimates. Results from the analysis of simulated migrant tract data are shown, including median estimates (diamonds) and 95% confidence intervals (the 2.5 and 97.5 percentiles of the distribution of estimates) for (A) m1, (B) m2, and (C) T. The order of parameter sets is the same in each panel (i.e., the far left estimates are for true values of m1 = 0, m2 = 1E−5, and T = 100).

