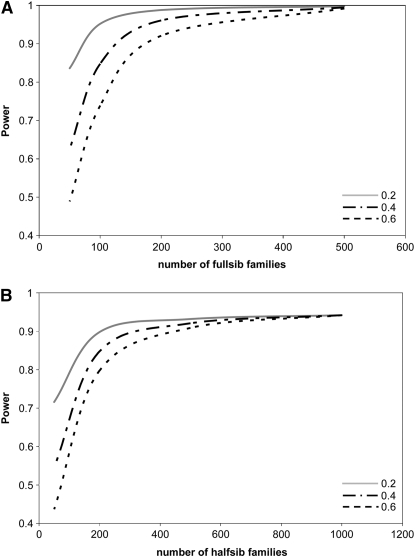
Figure 2.—
Effect of the number of full- and half-sib families on the power (1 − β) of the full-sib (FS) (A) and classic half-sib (HS) (B) designs for a common phenotyping effort of 1000 individuals where α = 0.05. As family number varies, the numbers of m and n have been scaled to reflect the common phenotyping effort; thus an analysis involving 100 families implies a value of m = 10 and so on. The QTN explains 5% of the phenotypic variance (i.e., q2 = 0.05). Corresponding power for the direct approach is 1.0 in both cases and profiles for three narrow-sense heritability values are shown.

