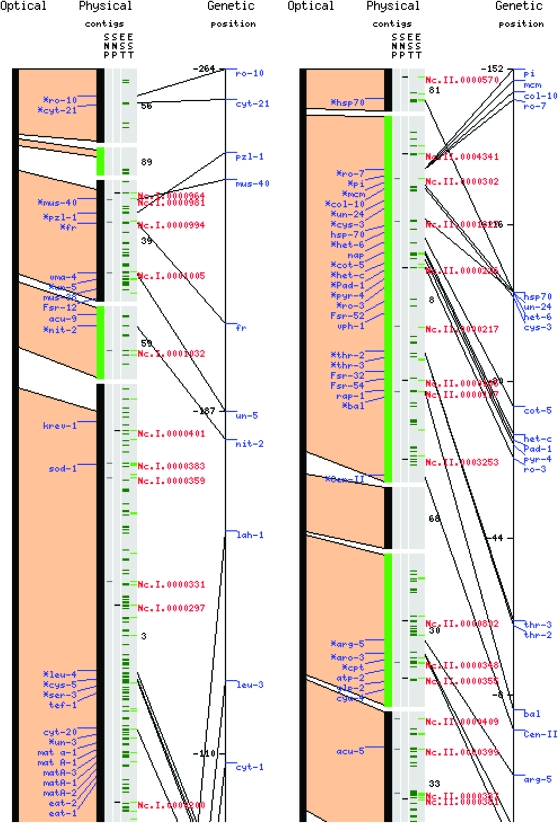
Figure 3.—
Distribution of sequenced ESTs and CAPS markers. Optical, physical, and genetic maps of the left arms of N. crassa linkage groups I and II. In the gray bars marked “EST,” bright green dashes represent 3-kbp bins in which EST sequences used for genomewide validation were obtained; dark green dashes, idem for additional EST data. In the bar marked “SNP” red dashes represent confirmed CAPS markers, black dashes confirmed CAPS markers that were selected for inclusion in the master plates. Exact location, primer sequences, and restriction enzymes are given in supplemental Table S1.

