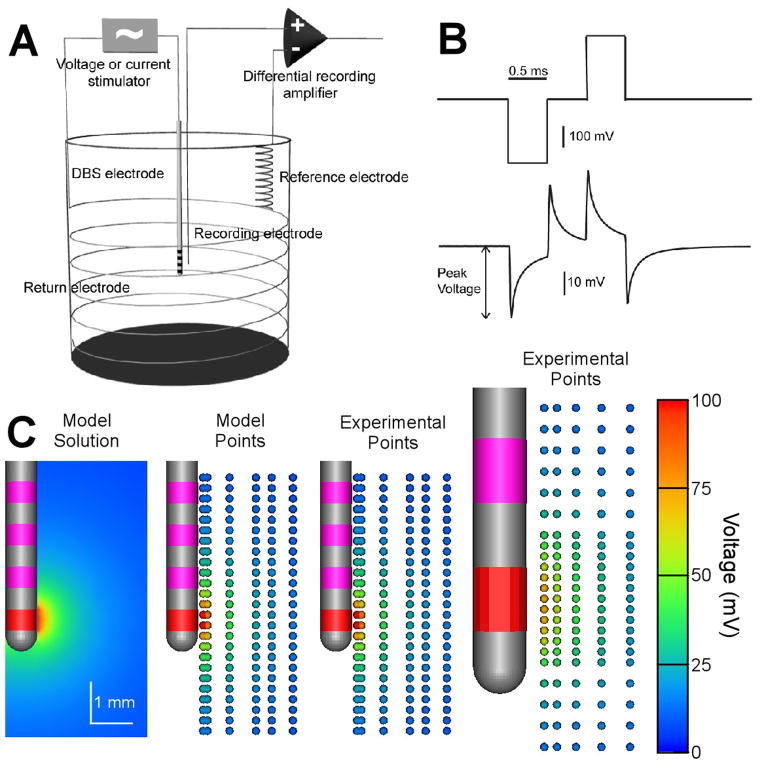
Figure 1.
In vitro voltage recordings using monkey and human DBS electrodes. A) In vitro recordings were performed with a four-electrode setup. A constant voltage or constant current stimulus was applied across the DBS electrode and a return electrode. The response voltage was measured between the microelectrode and reference electrode. B) Voltage-controlled stimulus waveform and recording from the medium. C) Voltage distribution maps. The active electrode contact is red and the inactive contacts are pink. Left: Voltage distribution map obtained from finite element model optimized to fit the in vitro recording data. Middle: Individual recording locations are marked with small spheres; sphere color indicates recorded peak voltage. Right: Experimental data recorded from human DBS electrode. Stimulus amplitude was 0.3 V. Voltage drop at the electrode-electrolyte interface limited the peak voltage recorded in the medium.

