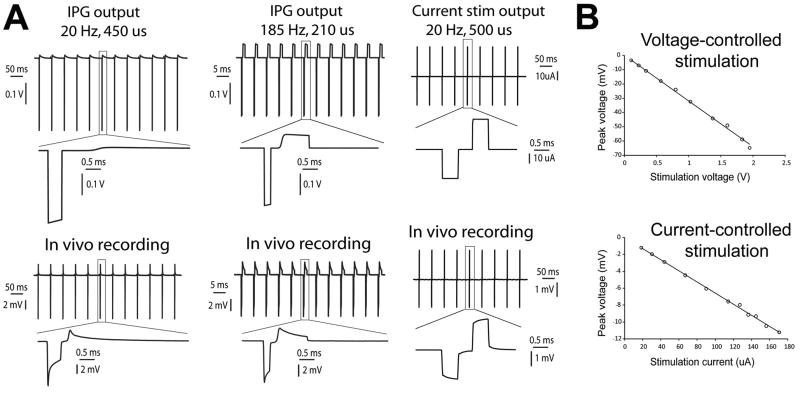
Figure 3.
In vivo stimulus waveform recordings. A. Voltage-controlled (IPG) and current-controlled stimulus waveforms at 20 Hz and 185 Hz recorded across a 1 kΩ resistor (top) and corresponding voltage responses recorded in vivo (bottom). B. The peak voltage recorded in vivo was proportional to the applied stimulus amplitude for both voltage-controlled and current-controlled stimulation.

