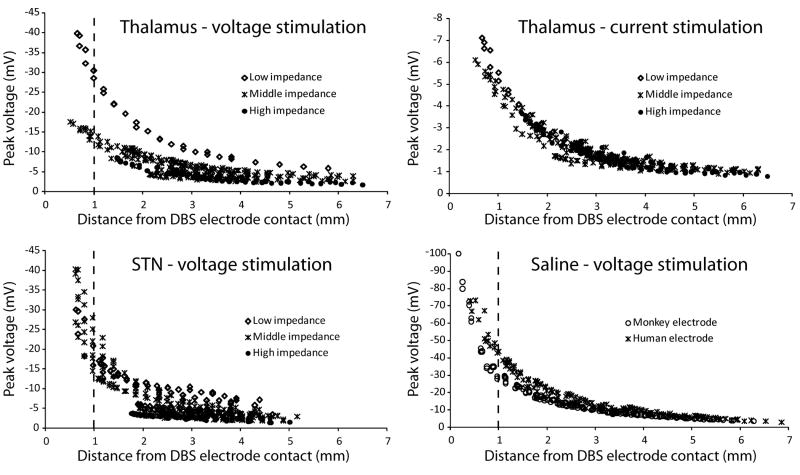
Figure 4.
In vivo peak voltages. Individual voltage recordings plotted against the distance from the microelectrode tip to the active DBS electrode contact. The data was classified according to DBS electrode impedance. Low DBS electrode impedance was defined as less than 3 kΩ, medium impedance as 3–5 kΩ, and high impedance as more than 5 kΩ. Thalamic data included 11 recording tracks (30 recording locations in each track) collected over 4 days using the same DBS contact for stimulation. Data for thalamic voltage-controlled and current-controlled stimulation were collected at the same time so recording locations were identical. STN data includes 16 recording tracks (27 recording locations in each track) collected over 8 days. Saline data was divided according to the type of DBS electrode used (monkey vs. human – lower right plot). Monkey electrode data consisted of 7 tracks (33 locations in each track) recorded over 2 days. Human electrode data consisted of 7 tracks (23 locations in each track) recorded during 1 day. The stimulus amplitude was 0.3 V or 30 μA.

