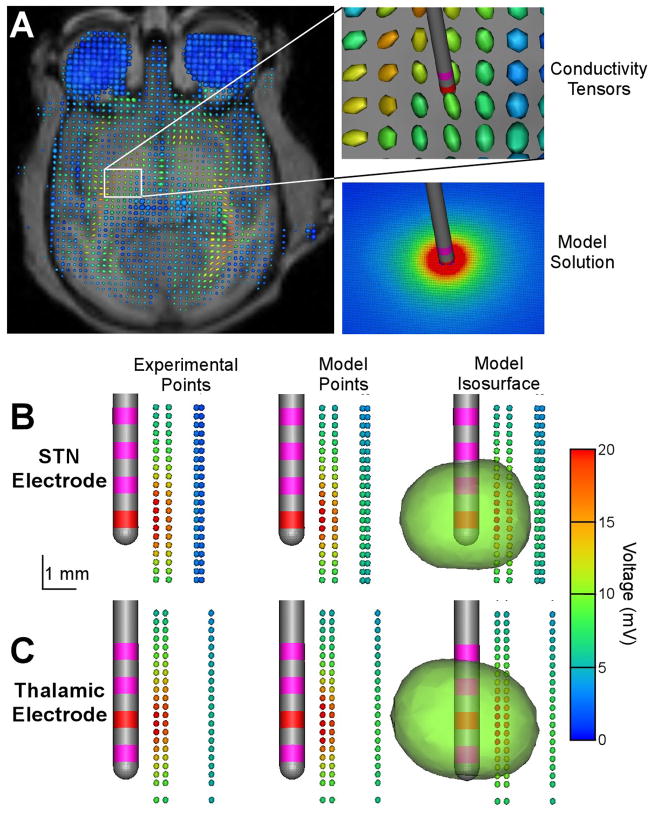
Figure 5.
In vivo voltage distribution model. A) Electrical conductivity of the brain was estimated on a voxel-by-voxel basis using diffusion tensor data. Conductivity tensors are represented as an ellipsoid with its long axis indicating the direction of highest conductivity and the color representing the degree of anisotropy (red – anisotropic, blue – isotropic). B, C) Experimental recordings, corresponding model solutions and an example model 3D voltage isosurface at 10 mV for the STN (B) and thalamic (C) DBS electrode. For both B and C the recording tracks were acquired parallel to and posterior from the DBS electrode trajectory.

