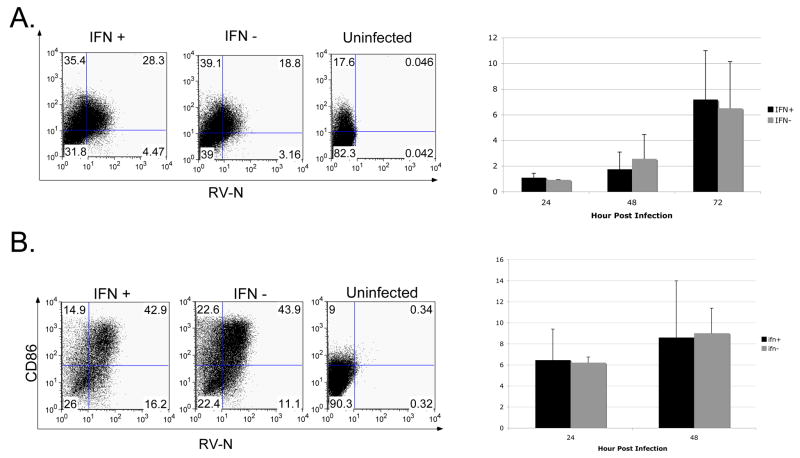
FIGURE 6. The effect of IFN-β on antigen presenting cell activation.
(A) Macrophage cells (Raw264.7) increased expression of CD80 over time following infection at an MOI of 10 with IFN(+) and IFN(−). The left panel shows one representative experiment at 72 hpi. The right panel shows the average fold increase in MFI over the uninfected sample (representative of 3 independent experiments). (B) The expression of CD86 on dendritic cell line JAWSII over time following infection at an MOI of 10 with IFN(+) or IFN(−) RV. The left panel shows one representative experiment at 48 hpi. The right panel shows the average fold increase in MFI over the uninfected sample (2 independent experiments).

