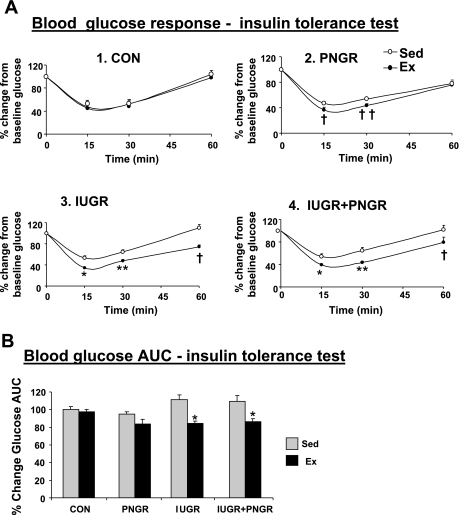
Fig. 3.
A: %change in plasma glucose concentration from the “0” time point value during insulin tolerance test is shown in Ex and Sed states in individual graphs (graph 1, CON; graph 2, PNGR; graph 3, IUGR; graph 4, IUGR + PNGR). Holm-Sidak test shows significant response in Ex PNGR, Ex IUGR, and Ex IUGR + PNGR groups (†P < 0.01, ††P < 0.03, *P < 0.0001, **P < 0.0004) compared with corresponding Sed group at the same time point. B: AUC for %change in plasma glucose concentration during the insulin tolerance test for all Ex and Sed groups is shown. Two-way ANOVA revealed a significant effect of exercise alone (F = 34.793, P < 0.001) and exercise × pre/postnatal nutrition (F = 3.16, P < 0.03) but not of pre/postnatal nutrition alone (F = 2.763, P = 0.057). Holm-Sidak test demonstrated a difference at *P < 0.0001 between Ex IUGR and Ex IUGR + PNGR vs. their corresponding Sed groups; n = 6 for all study groups, except n = 5 each for Sed and Ex PNGR groups alone.

