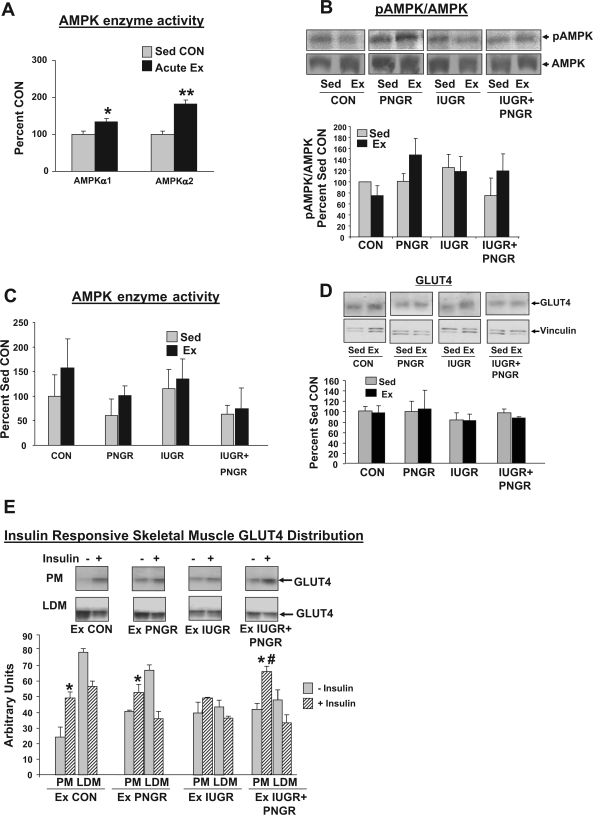
Fig. 5.
A: skeletal muscle AMPKα1 and -α2 isoform-specific activities measured 15 min after acute Ex (n = 4) or in a Sed state (n = 3) and expressed as a percent of the sedentary CON state are shown in a subgroup of control animals. *P < 0.04, acute Ex vs. Sed CON; **P < 0.01, acute Ex vs. Sed CON. B: skeletal muscle pAMPK and total AMPK protein concentrations measured 48–72 h after last bout of exercise training (n = 3–4 each for all groups) did not significantly change when compared with the Sed counterpart (n = 3–4 each for all groups). Representative Western blots are shown at top, and the densitometric quantification of pAMPK/total AMPK expressed as a percent of Sed CON is shown as a bar graph. C: skeletal muscle AMPK (AMPKα1 and -α2 isoforms) enzyme activity measured 48–72 h after the last bout of exercise training and expressed as a percent of Sed CON did not show any significant difference when compared to the sedentary counterpart (n = 3–4 each for all Ex and Sed groups). D: skeletal muscle total GLUT4 protein concentrations were no different between the Sed and Ex groups (n = 3 each for all groups). Representative Western blots of GLUT4 and vinculin (internal control) are shown at top, and the densitometric quantification of total GLUT4/vinculin expressed as a percent of Sed CON is shown as a bar graph. E: basal and insulin-responsive skeletal muscle GLUT4 distribution in plasma membrane (PM) and low-density microsomes (LDM) of Ex CON, Ex PNGR, Ex IUGR, and Ex IUGR + PNGR is shown; n = 3 each for PM and LDM in all experimental groups. Top: representative Western blots of GLUT4 in PM and LDM subfractions in the presence (+) and absence (−) of insulin administration in the 4 Ex groups (Ex CON, Ex PNGR, Ex IUGR, and Ex IUGR + PNGR). The densitometric quantification is expressed in arbitrary units as a bar graph. PM GLUT4 concentrations increased after insulin administration (+) vs. the corresponding basal state (−) in Ex CON, Ex PNGR, and Ex IUGR + PNGR (*P < 0.05) but not in Ex IUGR. PM GLUT4 concentrations in the Ex IUGR + PNGR were higher than Ex CON (#P < 0.05). Sed state results were reported previously (41) and not shown.

